Acceleration units are expressed as length per time divided by time such as meters/second/second or in abbreviated form as m/s 2.
The distance versus time graph in Figure shows the progress of a person (I) standing still, (II) walking with a constant velocity, and (III) walking with a slower constant velocity. The slope of the line yields the speed. For example, the speed in segment II is

Figure 1
Motion of a walking person.
Each segment in the velocity versus time graph in Figure depicts a different motion of a bicycle: (I) increasing velocity, (II) constant velocity, (III) decreasing velocity, and (IV) velocity in a direction opposite the initial direction (negative). The area between the curve and the time axis represents the distance traveled. For example, the distance traveled during segment I is equal to the area of the triangle with height 15 and base 10. Because the area of a triangle is (1/2)(base)(height), then (1/2)(15 m/s)(10 s) = 75 m. The magnitude of acceleration equals the calculated slope. The acceleration calculation for segment III is (−15 m/s)/(10 s) = −1.5 m/s/s or −1.5 m/s 2.
Figure 2
Accelerating motion of a bicycle
The more realistic distance‐versus‐time curve in Figure (a) illustrates gradual changes in the motion of a moving car. The speed is nearly constant in the first 2 seconds, as can be seen by the nearly constant slope of the line; however, between 2 and 4 seconds, the speed is steadily decreasing and the instantaneous velocity describes how fast the object is moving at a given instant.

Figure 3
Motion of a car: (a) distance, (b) velocity, and (c) acceleration change in time.
Instantaneous velocity can be read on an odometer in the car. It is calculated from a graph as the slope of a tangent to the curve at the specified time. The slope of the line sketched at 4 seconds is 6 m/s. Figure (b) is a sketch of the velocity‐versus‐time graph constructed from the slopes of the distance‐versus‐time curve. In like fashion, the instantaneous acceleration is found from the slope of a tangent to the velocity‐versus‐time curve at a given time. The instantaneous acceleration‐versus‐time graph in Figure (c) is the sketch of the slopes of the velocity‐versus‐time graph of Figure (b). With the vertical arrangement shown, it is easy to compute the displacement, velocity, and acceleration of a moving object at the same time.
For example, at time t = 10 s, the displacement is 47 m, the velocity is −5 m/s, and the acceleration is −5 m/s 2.
The instantaneous velocity, by definition, is the limit of the average velocity as the measured time interval is made smaller and smaller. In formal terms,  . The notation
  means the ratio
  is evaluated as the time interval approaches zero. Similarly, instantaneous acceleration is defined as the limit of the average acceleration as the time interval becomes infinitesimally short. That is,
  .
.
When an object moves with constant acceleration, the velocity increases or decreases at the same rate throughout the motion. The average acceleration equals the instantaneous acceleration when the acceleration is constant. A negative acceleration can indicate either of two conditions:
- Case 1: The object has a decreasing velocity in the positive direction.
- Case 2: The object has an increasing velocity in the negative direction.
For example, a ball tossed up will be under the influence of a negative (downward) acceleration due to gravity. Its velocity will decrease while it travels upward (case 1); then, after reaching its highest point, the velocity will increase downward as the object returns to earth (case 2).
Using v o (velocity at the beginning of time elapsed), v f (velocity at the end of the time elapsed), and t for time, the constant acceleration is
 (1)
(1)
Substituting the average velocity as the arithmetic average of the original and final velocities v avg = ( v o + v f )/2 into the relationship between distance and average velocity d = ( v avg)( t) yields.
 (2)
(2)
Substitute v f from Equation 1 into Equation 2 to obtain
 (3)
(3)
Finally, substitute the value of t from Equation 1 into Equation 2 for
 (4)
(4)
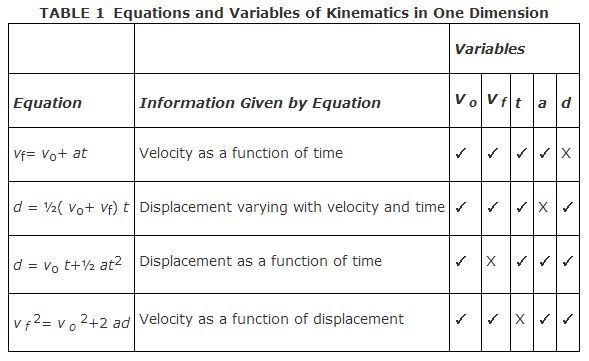
These four equations relate v o , v f , t, a, and d. Note that each equation has a different set of four of these five quantities. Table summarizes the equations for motion in a straight line under constant acceleration.

A special case of constant acceleration occurs for an object under the influence of gravity. If an object is thrown vertically upward or dropped, the acceleration due to gravity of −9.8 m/s 2 is substituted in the above equations to find the relationships among velocity, distance, and time.