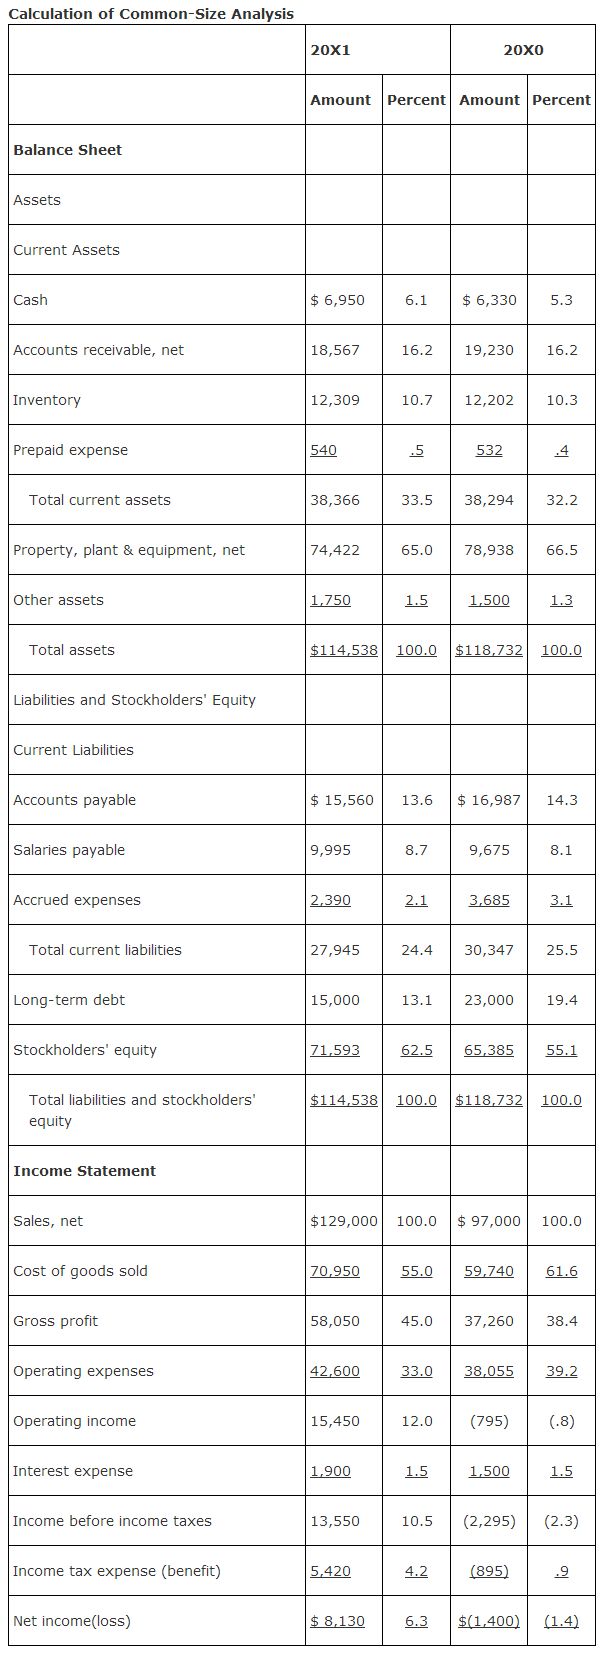
Common‐size analysis (also called vertical analysis) expresses each line item on a single year's financial statement as a percent of one line item, which is referred to as a base amount. The base amount for the balance sheet is usually total assets (which is the same number as total liabilities plus stockholders' equity), and for the income statement it is usually net sales or revenues. By comparing two or more years of common‐size statements, changes in the mixture of assets, liabilities, and equity become evident. On the income statement, changes in the mix of revenues and in the spending for different types of expenses can be identified.
A common‐size analysis for the latest two years of The Home Project Company is shown in the following example. To calculate the common‐size for the 20X1 balance sheet, each amount was divided by $114,538, the “total asset” amount. For the 20X0 balance sheet, the common‐size percentages were calculated by dividing by $118,732, “total assets.” For the 20X1 income statement, each amount was divided by $129,000 the “sales, net” amount, and for the 20X0 income statement, each amount was divided by $97,000, the “sales, net” amount
.

|
|
|
|
|
|
|
|
|
|
|
|
|
|
|
|
|
|
|
|
|
|
|
|
|
|
|
|
|
|
|