Ratio analysis is used to evaluate relationships among financial statement items. The ratios are used to identify trends over time for one company or to compare two or more companies at one point in time. Financial statement ratio analysis focuses on three key aspects of a business: liquidity, profitability, and solvency.
Liquidity ratios measure the ability of a company to repay its short‐term debts and meet unexpected cash needs.
Current ratio. The current ratio is also called the working capital ratio, as working capital is the difference between current assets and current liabilities. This ratio measures the ability of a company to pay its current obligations using current assets. The current ratio is calculated by dividing current assets by current liabilities.
![]()

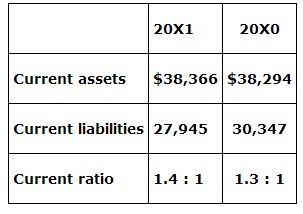
This ratio indicates the company has more current assets than current liabilities. Different industries have different levels of expected liquidity. Whether the ratio is considered adequate coverage depends on the type of business, the components of its current assets, and the ability of the company to generate cash from its receivables and by selling inventory.
Acid‐test ratio. The acid‐test ratio is also called the quick ratio. Quick assets are defined as cash, marketable (or short‐term) securities, and accounts receivable and notes receivable, net of the allowances for doubtful accounts. These assets are considered to be very liquid (easy to obtain cash from the assets) and therefore, available for immediate use to pay obligations. The acid‐test ratio is calculated by dividing quick assets by current liabilities.
![]()

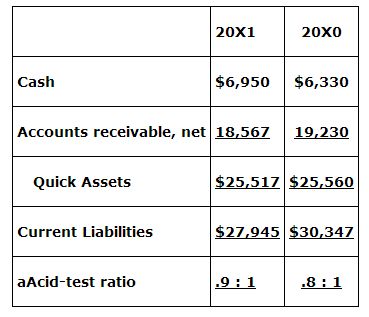
The traditional rule of thumb for this ratio has been 1:1. Anything below this level requires further analysis of receivables to understand how often the company turns them into cash. It may also indicate the company needs to establish a line of credit with a financial institution to ensure the company has access to cash when it needs to pay its obligations.
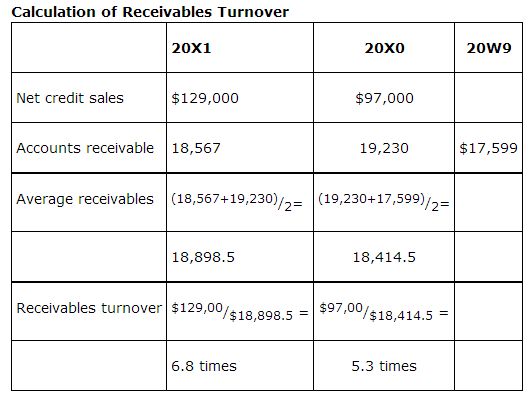
Receivables turnover. The receivable turnover ratio calculates the number of times in an operating cycle (normally one year) the company collects its receivable balance. It is calculated by dividing net credit sales by the average net receivables. Net credit sales is net sales less cash sales. If cash sales are unknown, use net sales. Average net receivables is usually the balance of net receivables at the beginning of the year plus the balance of net receivables at the end of the year divided by two. If the company is cyclical, an average calculated on a reasonable basis for the company's operations should be used such as monthly or quarterly.
![]()

Average collection period. The average collection period (also known as day's salesoutstanding) is a variation of receivables turnover. It calculates the number of days it will take to collect the average receivables balance. It is often used to evaluate the effectiveness of a company's credit and collection policies. A rule of thumb is the average collection period should not be significantly greater than a company's credit term period. The average collection period is calculated by dividing 365 by the receivables turnover ratio.
![]()

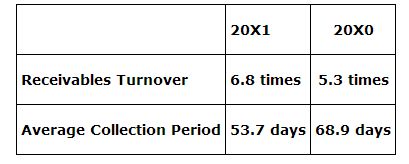
The decrease in the average collection period is favorable. If the credit period is 60 days, the 20X1 average is very good. However, if the credit period is 30 days, the company needs to review its collection efforts.
Inventory turnover. The inventory turnover ratio measures the number of times the company sells its inventory during the period. It is calculated by dividing the cost of goods sold by average inventory. Average inventory is calculated by adding beginning inventory and ending inventory and dividing by 2. If the company is cyclical, an average calculated on a reasonable basis for the company's operations should be used such as monthly or quarterly.
![]()

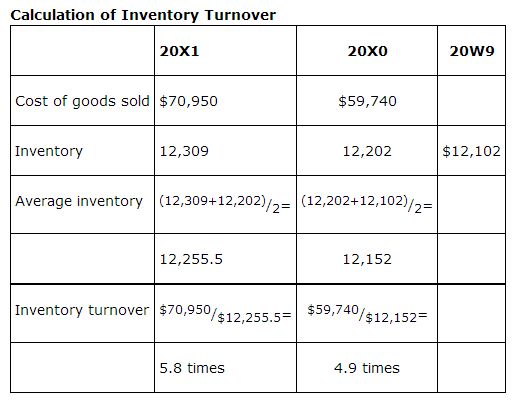
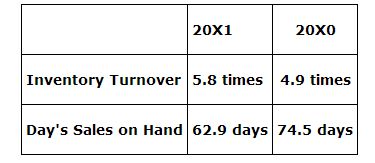
Day's sales on hand. Day's sales on hand is a variation of the inventory turnover. It calculates the number of day's sales being carried in inventory. It is calculated by dividing 365 days by the inventory turnover ratio.
![]()

Profitability ratios
Profitability ratios measure a company's operating efficiency, including its ability to generate income and therefore, cash flow. Cash flow affects the company's ability to obtain debt and equity financing.
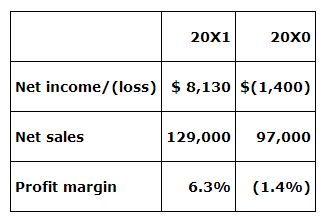
Profit margin. The profit margin ratio, also known as the operating performance ratio, measures the company's ability to turn its sales into net income. To evaluate the profit margin, it must be compared to competitors and industry statistics. It is calculated by dividing net income by net sales.
![]()
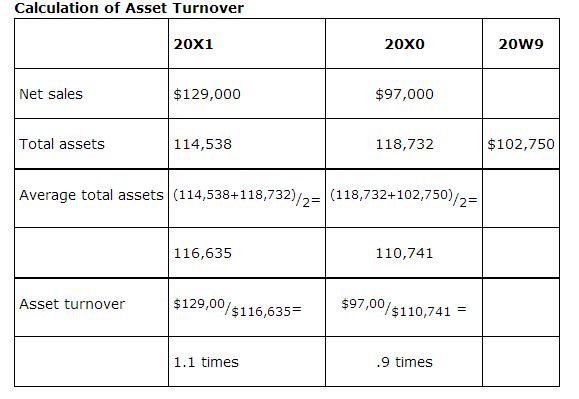
Asset turnover. The asset turnover ratio measures how efficiently a company is using its assets. The turnover value varies by industry. It is calculated by dividing net sales by average total assets.
![]()

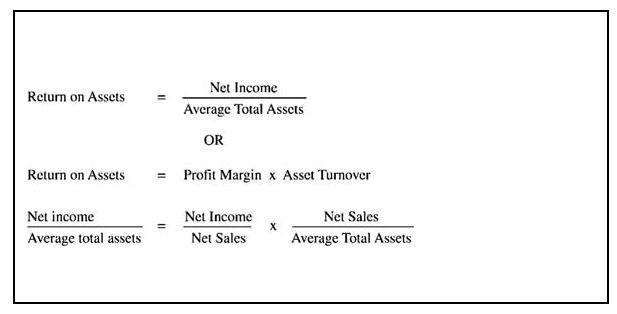
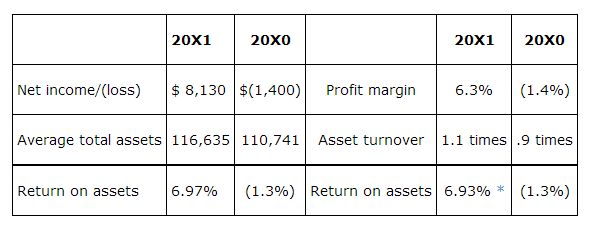
Return on assets. The return on assets ratio (ROA) is considered an overall measure of profitability. It measures how much net income was generated for each $1 of assets the company has. ROA is a combination of the profit margin ratio and the asset turnover ratio. It can be calculated separately by dividing net income by average total assets or by multiplying the profit margin ratio times the asset turnover ratio.
![]()
The information shown in equation format can also be shown as follows:
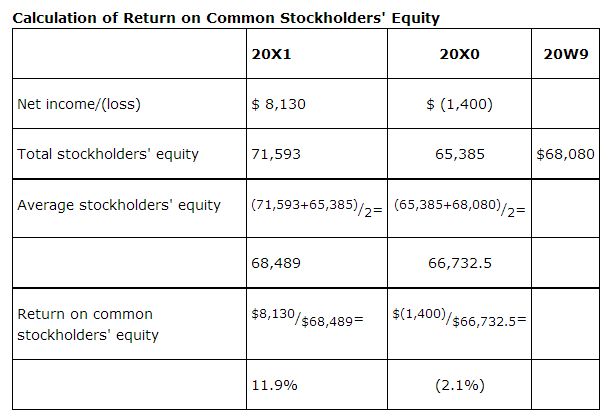
Return on common stockholders' equity. The return on common stockholders' equity (ROE) measures how much net income was earned relative to each dollar of common stockholders' equity. It is calculated by dividing net income by average common stockholders' equity. In a simple capital structure (only common stock outstanding), average common stockholders' equity is the average of the beginning and ending stockholders' equity.
![]()

In a complex capital structure, net income is adjusted by subtracting the preferred dividend requirement, and common stockholders' equity is calculated by subtracting the par value (or call price, if applicable) of the preferred stock from total stockholders' equity.

![]()
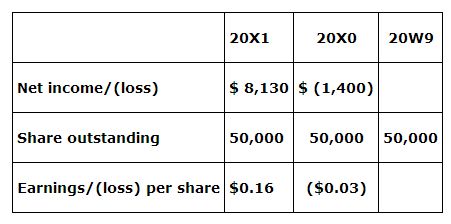
Earnings per share. Earnings per share (EPS) represents the net income earned for each share of outstanding common stock. In a simple capital structure, it is calculated by dividing net income by the number of weighted average common shares outstanding.

![]()
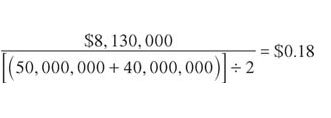
Assuming The Home Project Company has 50,000,000 shares of common stock outstanding, EPS is calculated as follows:
Calculation notes:
-
If the number of shares of common stock outstanding changes during the year, the weighted average stock outstanding must be calculated based on shares actually outstanding during the year. Assuming The Home Project Company had 40,000,000 shares outstanding at the end of 20X0 and issued an additional 10,000,000 shares on July 1, 20X1, the earnings per share using weighted average shares for 20X1 would be $0.18. The weighted average shares was calculated by 2 because the new shares were issued half way through the year.
-
If preferred stock is outstanding, preferred dividends declared should be subtracted from net income before calculating EPS.
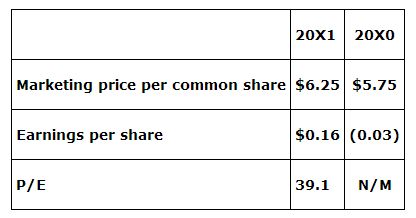
Price‐earnings ratio. The price‐earnings ratio (P/E) is quoted in the financial press daily. It represents the investors' expectations for the stock. A P/E ratio greater than 15 has historically been considered high.

![]()
If the market price for The Home Project Company was $6.25 at the end of 20X1 and $5.75 at the end of 20X0, the P/E ratio for 20X1 is 39.1.
Payout ratio. The payout ratio identifies the percent of net income paid to common stockholders in the form of cash dividends. It is calculated by dividing cash dividends by net income.

![]()
Cash dividends for The Home Project Company for 20X1 and 20X0 were $1,922,000 and $1,295,000, respectively, resulting in a payout ratio for 20X1 of 23.6%.
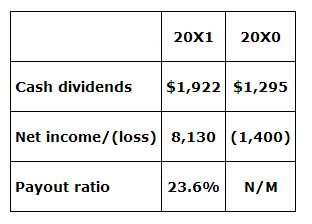
A more stable and mature company is likely to pay out a higher portion of its earnings as dividends. Many startup companies and companies in some industries do not pay out dividends. It is important to understand the company and its strategy when analyzing the payout ratio.
Dividend yield. Another indicator of how a corporation performed is the dividend yield. It measures the return in cash dividends earned by an investor on one share of the company's stock. It is calculated by dividing dividends paid per share by the market price of one common share at the end of the period.

![]()
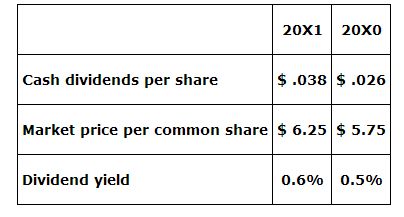
A low dividend yield could be a sign of a high growth company that pays little or no dividends and reinvests earnings in the business or it could be the sign of a downturn in the business. It should be investigated so the investor knows the reason it is low.
Solvency ratios are used to measure long‐term risk and are of interest to long‐term creditors and stockholders.
Debt to total assets ratio. The debt to total assets ratio calculates the percent of assets provided by creditors. It is calculated by dividing total debt by total assets. Total debt is the same as total liabilities.

![]()
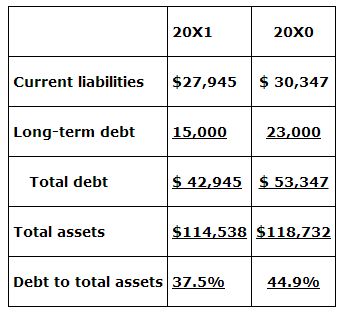
The 20X1 ratio of 37.5% means that creditors have provided 37.5% of the company's financing for its assets and the stockholders have provided 62.5%.
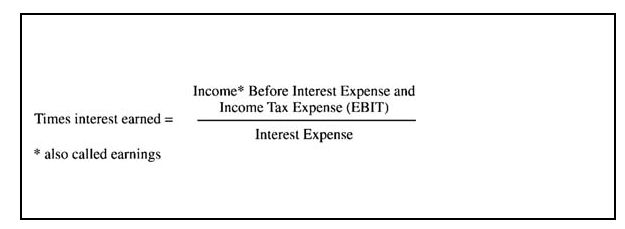
Times interest earned ratio. The times interest earned ratio is an indicator of the company's ability to pay interest as it comes due. It is calculated by dividing earnings before interest and taxes (EBIT) by interest expense.
![]()
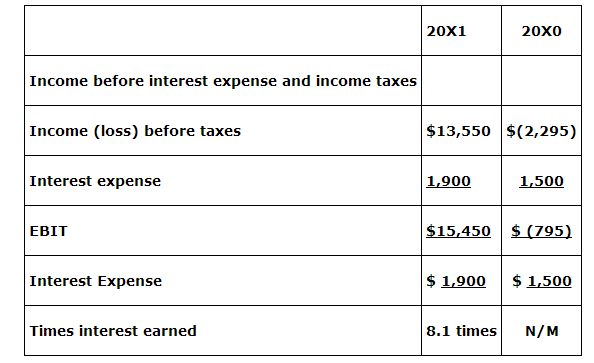
A times interest earned ratio of 2–3 or more indicates that interest expense should reasonably be covered. If the times interest earned ratio is less than two it will be difficult to find a bank to loan money to the business.