In the market for any particular good X, the decisions of buyers interact simultaneously with the decisions of sellers. When the demand for good X equals the supply of good X, the market for good X is said to be in equilibrium. Associated with any market equilibrium will be an equilibrium quantity and an equilibrium price. The equilibrium quantity of good X is that quantity for which the quantity demanded of good X exactly equals the quantity supplied of good X. The equilibrium price for good X is that price per unit of good X that allows the market to “clear”; that is, the price for which the quantity demanded of good X exactly equals the quantity supplied of good X. The determination of equilibrium quantity and price, known as equilibrium analysis, can be achieved in two different ways: by simultaneously solving the algebraic equations for demand and supply or by combining the demand and supply curves in a single graph and determining the equilibrium price and quantity graphically.
The algebraic approach to equilibrium. The algebraic approach to equilibrium analysis is to solve, simultaneously, the algebraic equations for demand and supply. In the example given above, the demand equation for good X was

and the supply equation for good X was
![]()

![]()
To solve simultaneously, one first rewrites either the demand or the supply equation as a function of price. In the example above, the supply curve may be rewritten as follows:
![]()

![]()
![]()
![]()
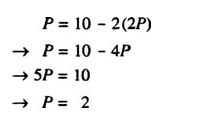
Substituting this expression into the demand equation, one can solve for the equilibrium price:
![]()
![]()

![]()
![]()
![]()
![]()
The equilibrium price of good X is found to be $2. Substituting the equilibrium price of 2 into the rewritten supply equation for good X, one has:
![]()
![]()
![]()

![]()
![]()
![]()
![]()
![]()
The equilibrium quantity is found to be 4 units of good X.
![]()
![]()
![]()
![]()
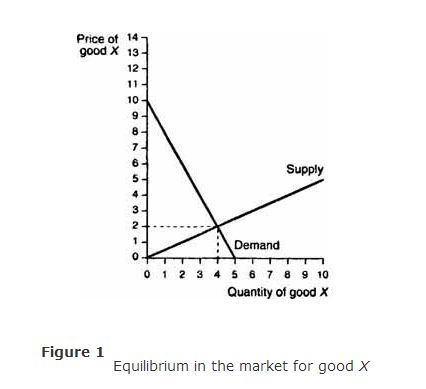
A graphical depiction of equilibrium. The graphical approach to equilibrium analysis is illustrated in Figure . The equilibrium price and quantity are determined by the intersection of the two curves. The equilibrium quantity is 4 units of good X, and the equilibrium price is $2 per unit of good X. This result is the same as the one obtained by simultaneously solving the algebraic equations for demand and supply.

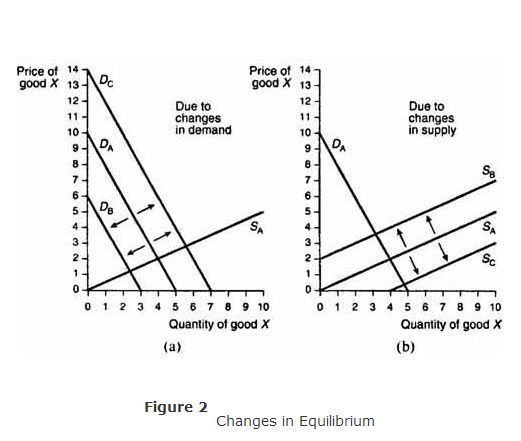
A price of $2 and a quantity of 4 units of X are the equilibrium price and quantity only when the demand and supply for good X are exactly as depicted in Figure . If either the demand curve or the supply curve shifts, the equilibrium price and quantity change. Examples of shifts in the demand and supply curves and the resultant changes in equilibrium are illustrated in Figures (a) and (b). In Figure (a), a shift to left of the demand curve, from D A to D B, leads to a decrease in both the equilibrium price and quantity of good X, while a shift to the right of the demand curve, from D A to D C, leads to an increase in both the equilibrium price and quantity of good X, assuming supply is held constant‐the ceteris paribus assumption. In Figure (b), a shift to the left of the supply curve, from S A to S B, leads to an increase in the equilibrium price of good X but a decrease in the equilibrium quantity of good X, assuming demand is held constant. A shift to the right of the supply curve, from S A to S C, leads to a decrease in the equilibrium price of good X but an increase in the equilibrium quantity of good X, again assuming that demand is held constant.


|
|
|
|
|
|
|
|
|
|
|
|
|
![]()