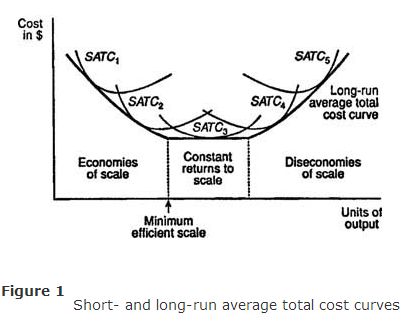
In the short‐run, some factors of production are fixed. Corresponding to each different level of fixed factors, there will be a different short‐run average total cost curve (SATC). The average total cost curve is just one of many SATCs that can be obtained by varying the amount of the fixed factor, in this case, the amount of capital.
Long‐run average total cost curve. In the long‐run, all factors of production are variable, and hence, all costs are variable. The long‐run average total cost curve (LATC) is found by varying the amount of all factors of production. However, because each SATC corresponds to a different level of the fixed factors of production, the LATC can be constructed by taking the “lower envelope” of all the SATCs, as is illustrated in Figure .

The LATC is shown to be tangent to each of five different SATCs, labeled SATC 1 through SATC 5 . In general, there will be a large number of SATCs, each of which corresponds to a different level of the fixed factors the firm can employ in the short‐run. Because there is such a large number of SATCs—more than just the five illustrated in Figure —the lower envelope of all the SATCs, which makes up the LATC, can be approximated by a smooth, U‐shaped curve.
Economies of scale. The U‐shape of the LATC, depicted in Figure , reflects the changing costs of production that the firm faces in the long‐run as it varies the level of its factors of production and hence the level of its output. At low levels of output, a firm can usually increase its output at a rate that exceeds the rate at which it increases its factor inputs. When this situation occurs, the firm's average total costs are falling, and the firm is said to be experiencing economies of scale.

At higher levels of output, the firm may find that its output increases at the same rate at which it increases its factor inputs. In this case, the firm's average total costs remain constant, and the firm is said to experience constant returns to scale. At even higher output levels, the firm's output will tend to increase at a rate that is below the rate at which it increases its factor inputs. In this situation, average total costs are rising, and the firm is said to experience diseconomies of scale.
The firm's minimum efficient scale is the level of output at which economies of scale end and constant returns to scale begin. The minimum efficient scale is indicated in Figure .