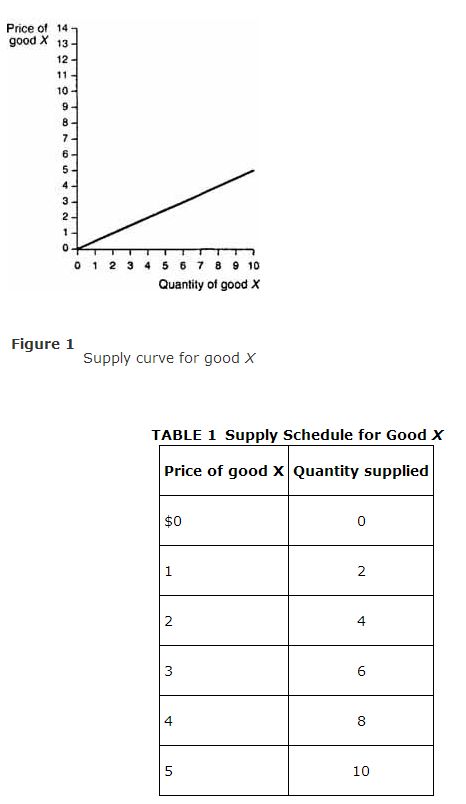
The buyers' demand for goods is not the only factor determining market prices and quantities. The sellers' supply of goods also plays a role in determining market prices and quantities. Like the buyers' demand, the sellers' supply can be represented in three different ways: by a supply schedule, by a supply curve, and algebraically. An example of a supply schedule for a certain good X is given in Table , and the corresponding supply curve is drawn in Figure . Note that as the price of good X increases, the quantity supplied of good X increases. This kind of behavior on the part of sellers is in accordance with the law of supply.

According to the law of supply, a direct relationship exists between the price of a good and the quantity supplied of that good. As the price of a good increases, sellers are willing to supply more of that good. The law of supply is also reflected in the upward‐sloping supply curve of Figure and in the algebraic equation of the supply schedule data of Table :

![]()
which has a positive slope of ½.
Change in the quantity supplied. A change in the quantity supplied is a movement along the supply curve due to a change in the price of the good supplied. Suppose, in Figure , the price changes from $4 to $3. The change in the quantity supplied is found by moving along the supply curve, in this case to the left, from the old quantity of 8 units of good X to the new quantity of 6 units of good X.
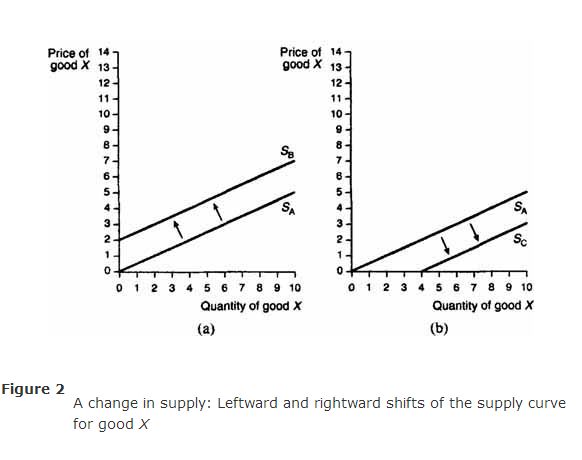
Change in supply. A change in supply, like a change in demand, is represented by a shift in the supply curve. Figures (a) and (b) illustrate two possible ways in which the supply curve for good X might shift:
A leftward shift of the original supply curve, labeled S A, to the new supply curve S B, as depicted in Figure (a), results in a reduced supply of good X at all prices. A rightward shift of the original supply curve S A to the new supply curve S C, as depicted in Figure (b), results in an increased supply of good X at all prices.

Reasons for a change in supply. A change in supply or shift of the supply curve is not caused by a change in the price of the good being supplied; that would induce a change in the quantity demanded and a movement along the supply curve. A shift in the supply curve is caused by other factors, including:
- Changes in the prices of other goods: Suppliers are frequently able to switch their production processes from one type of good to another. Farmers, for example, might decide to grow less wheat and more corn on the same land if the price of corn rises relative to the price of wheat. In this case, the supply curve for wheat would shift to the left, as in Figure (a), as a consequence of the higher price for corn.

2. Changes in the prices of inputs: The prices of the raw materials or inputs used to produce a good also cause the supply curve to shift. An increase in the prices of a good's inputs will raise costs to suppliers and cause suppliers to supply less of that good at all prices. Therefore, an increase in the prices of a good's inputs leads to a leftward shift of the supply curve for that good, as in Figure (a). A decrease in the prices of a good's inputs reduces costs and allows suppliers to supply more of that good at all prices. Therefore, a decrease in the prices of a good's inputs leads to a rightward shift of the supply curve for that good, as in Figure (b).
3. Changes in technology: Advances in technology often have the effect of lowering the costs of production, allowing suppliers to supply more goods at all prices. For example, the development of pesticides has reduced the amount of damage done to certain crops and therefore has reduced the cost of farming. The result has been an increase in the supply of these crops at all prices, which can be represented by a shift to the right in the supply curves for these crops, as in Figure (b).