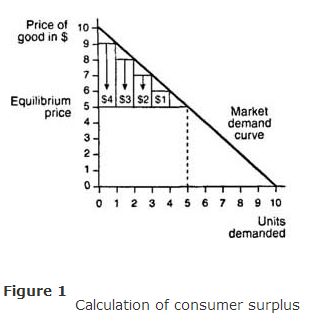
The difference between the maximum price that consumers are willing to pay for a good and the market price that they actually pay for a good is referred to as the consumer surplus. The determination of consumer surplus is illustrated in Figure , which depicts the market demand curve for some good.

The market price is $5, and the equilibrium quantity demanded is 5 units of the good. The market demand curve reveals that consumers are willing to pay at least $9 for the first unit of the good, $8 for the second unit, $7 for the third unit, and $6 for the fourth unit.
However, they can purchase 5 units of the good for just $5 per unit. Their surplus from the first unit purchased is therefore $9 ‐ $5 = $4. Similarly, their surpluses from the second, third, and fourth units purchased are $3, $2, and $1, respectively. These surpluses are illustrated by the vertical bars drawn in Figure . The sum total of these surpluses is the consumer surplus:

The value $10, however, is only a crude approximation of the true consumer surplus in this example. The true consumer surplus is given by the area below the market demand curve and above the market price. This area consists of a triangle with base of length 5 and height of length 5. Applying the rule for the area of a triangle—one half the base multiplied by height—one finds that the value of the consumer surplus in this example is actually 12.5.
|
|
|
|
|
|
|
|
|
![]()